The Three Critical Signals That Reveal Where Mesa Prices Head

A seller in east Mesa asked me last month whether Mesa home prices were about to drop, and the truthful answer was that the move had already started weeks earlier. Not in the price. In the data sitting underneath it. By the time a median sale price ticks down on a chart, the shift that caused it happened a month or two earlier in supply and demand. That lag is the single most useful thing a buyer or seller can understand about this market, and it is why I watch three leading signals more closely than the price itself.
Anyone can pull up last month’s median and react to it. The agents and investors who stay a step ahead are reading the indicators that bend first. Here are the three I lead with, what each one means, and what they are saying about Mesa right now.
Why Mesa Home Prices Always Move Last
Closed sale price is a lagging indicator. A price that records this week reflects a deal that was negotiated 30 to 60 days ago, on a rate that was locked weeks before that, in market conditions that may have already turned. You are looking at a photograph of the past, not a read on the present.
Supply and demand do not have that delay. They update in real time, every single day, as listings hit the market and buyers go under contract. When supply and demand shift, price follows a month or two later. So if you want to know where Mesa home prices are heading, you stop staring at the median and start watching what supply and demand are doing right now.
Months Of Supply Is The First Signal
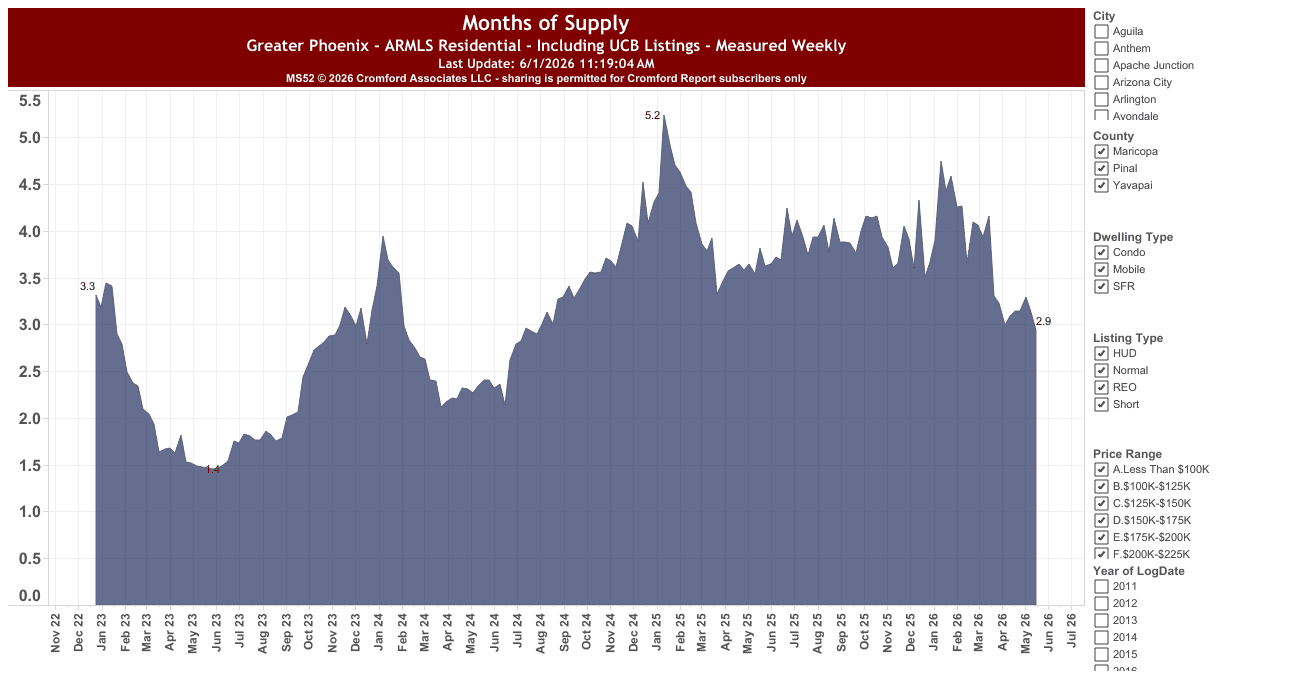
Months of supply answers one question: at the current pace of sales, how long would it take to sell every home currently for sale? A balanced market sits somewhere around four to six months. Below that, sellers hold the leverage. Above it, buyers do. The number itself matters less than the direction it is moving. Supply that is climbing month over month is the earliest warning that pricing power is sliding toward buyers, often well before any price reaction shows up.
Mesa, AZ
Months of Supply
Months of supply for Greater Phoenix ARMLS residential resale, including UCB listings · For a personalized Mesa analysis, connect with a Red Penny Realty agent.View Only
What Is Months of Supply?
Months of supply measures how long it would take to sell every home currently for sale at the current pace of sales. A reading near four to six months is considered balanced. Below that range sellers hold the leverage, and above it buyers do. It is one of the clearest snapshots of the balance between supply and demand.
What It Signals About Prices
The direction matters more than the number. Months of supply that climbs month over month is the earliest warning that pricing power is sliding toward buyers, usually well before any change shows up in closed sale prices. A falling line points the other way, toward firming prices and stronger seller leverage.
How to Use This Data
Sellers can use a rising supply trend as a signal to price ahead of the market rather than chase it down with reductions. Buyers can read the same trend as room to negotiate on price, repairs, and rate buydowns. Watching the slope over several months tells you more than any single reading.
Chart data provided by The Cromford Report. Copyright © The Cromford Report and Michael Orr. All rights reserved. Use of this data is subject to the Cromford Report Terms and Conditions.
Listings Under Contract Is The Second Signal
If months of supply is the supply side of the equation, listings under contract is the demand side. It counts the homes buyers have actually committed to right now, today, before anything closes. Because a typical Arizona contract takes about 30 to 45 days to reach the closing table, the under contract count is a preview of closed sales volume a month or more ahead. Rising under contract counts mean buyers are stepping in and demand is firming. Falling counts mean buyers are pulling back, and softer closed numbers are coming behind them.
Mesa, AZ
Listings Under Contract
Pre-filtered to listings under contract in the City of Mesa, AZ only · No other filters applied · For a personalized analysis, connect with a Red Penny Realty agent.View Only

What Are Listings Under Contract?
Listings under contract, also known as pending sales, represent homes where a buyer and seller have reached an agreement but the sale has not yet closed. This number is one of the most forward-looking indicators in real estate, giving you a real-time preview of where closed sales are headed in the next 30 to 60 days in Mesa.
What It Signals About Demand
When listings under contract in Mesa are rising, buyer demand is absorbing available supply and the market is strengthening. When the number is falling, demand is cooling and sellers may face longer wait times and more negotiation. Paired with active inventory, this metric helps paint a complete picture of market momentum.
How to Use This Data
Buyers can use contract volume to gauge how competitive the Mesa market currently is. High pending numbers mean competition is strong and timing matters. Sellers can use it to judge whether it is a good moment to list. When pending sales are outpacing new listings, conditions are ripe for a well-priced home to move quickly.
Chart data provided by The Cromford Report. Copyright © The Cromford Report and Michael Orr. All rights reserved. Use of this data is subject to the Cromford Report Terms and Conditions.
The Cromford Market Index Is The Third Signal
The first two signals are powerful on their own, but you still have to track them separately and judge how they line up against each other. Supply rising while demand falls is the strongest sign that prices are about to soften, because both sides of the equation are working against the seller at once. Supply falling while demand rises is the setup that precedes price gains. The hard part is watching two charts at the same time and weighing one against the other in your head. The third signal does that work for you.
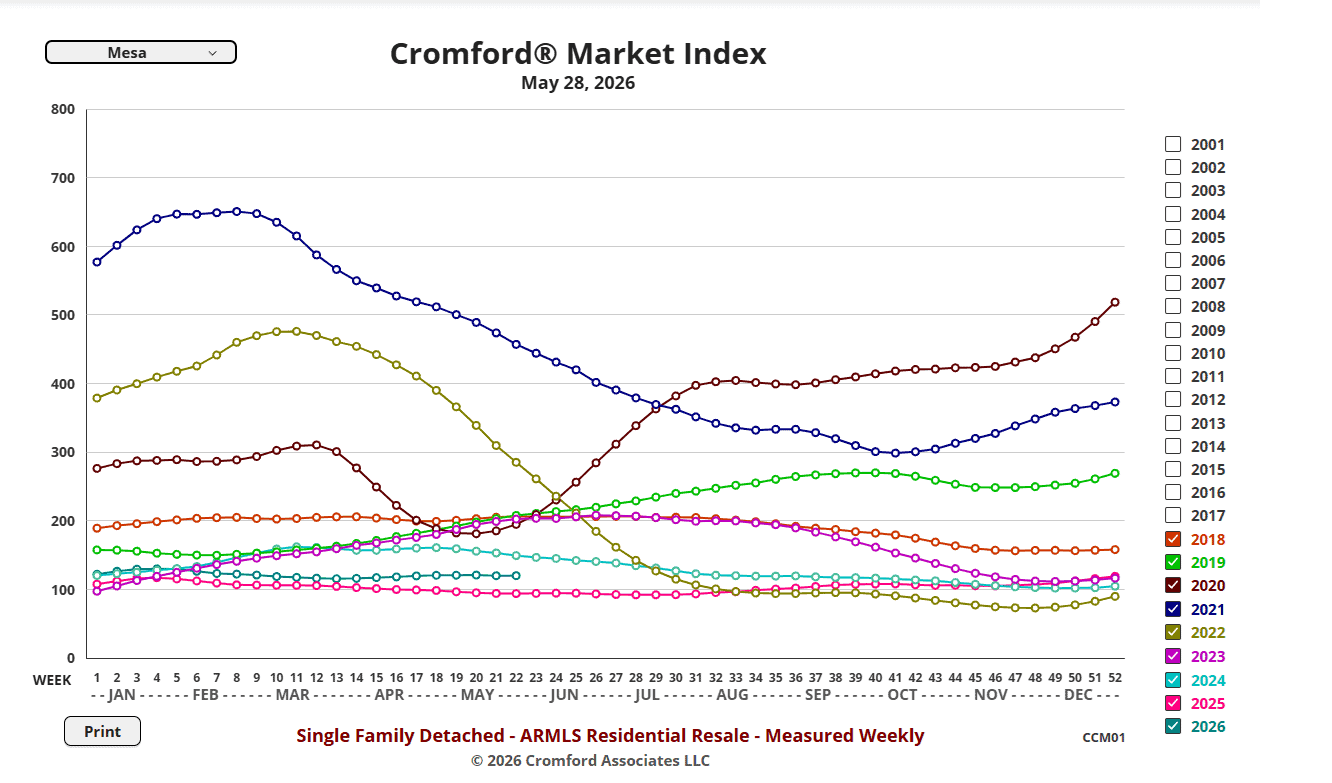
That is exactly what the Cromford Market Index does, built by Cromford Associates right here in Mesa. It compresses supply and demand into a single number where 100 is balanced, above 100 favors sellers, and below 100 favors buyers. The index direction tends to lead price by a month or two, which is why I treat a Cromford Market Index that has rolled over as a heads up long before the median confirms it. All three charts here are filtered to Mesa specifically, so you are watching our market, not a county average that buries what is happening in your zip code.
Mesa, AZ
Cromford Market Index
Cromford Market Index for the City of Mesa, AZ · Single family detached resale, measured weekly · For a personalized analysis, connect with a Red Penny Realty agent.View Only
What Is the Cromford Market Index?
The Cromford Market Index, built by Cromford Associates in Mesa, compresses supply and demand into a single number for each city. It is one of the most forward-looking gauges in the Greater Phoenix market because its direction tends to lead price by a month or two. Each line on the chart is one year plotted week by week.
What the Number Means
A reading of 100 is balanced between buyers and sellers. Above 100 favors sellers and below 100 favors buyers, and the further from 100, the stronger that advantage. As of late May 2026 Mesa sits around 120, slightly seller-leaning and far below the 2021 and 2022 peaks near 650 and 475. A break below 100 would be the early signal of real price softening.
How to Use This Data
Read the index alongside months of supply and listings under contract for a complete picture. Sellers can treat a falling index as a cue to price competitively before the market confirms the shift. Buyers can read the same move as growing negotiating room. The trend line matters more than any single weekly value.
Chart data provided by The Cromford Report. Copyright © The Cromford Report and Michael Orr. All rights reserved. Use of this data is subject to the Cromford Report Terms and Conditions.
As of late May 2026, Mesa’s index is hovering around 120. That is above the 100 balance line, so the market still leans slightly toward sellers, but only slightly, and a long way from the frenzy of three years ago. Read alongside the supply and demand charts above, it confirms the same story: supply and demand are close to even, leverage is drifting toward buyers in measured steps, and Mesa home prices are far more likely to grind sideways than to spike or collapse from here. If that index were to break decisively below 100, that would be the early signal that real price softening is coming, weeks before the median would show it.
What Mesa Home Prices Are Doing Right Now
Put the signals against today’s conditions and the picture is consistent. Greater Phoenix is normalizing, not crashing. Active inventory has been running roughly 13 percent above last year, with the metro sitting near two and a half months of supply, far healthier than the one month deserts of 2021 and 2022. Demand has been below its normal level but slowly recovering as mortgage rates have eased.
In Mesa specifically, the softening shows up clearly. The median list price was down about 7 percent year over year this spring, and close to 29 percent of active listings carried a price reduction, well above the national rate. Homes are taking noticeably longer to sell than they did a year ago. None of that is panic territory. It is a market handing leverage back to buyers in stages, and the three charts above let you watch that handoff happen in real time instead of finding out about it in a price report two months from now.
The Bottom Line For Buyers And Sellers
If you are selling, the move is to price to the signals, not to last year’s comps. A rising months of supply line and a falling under contract count mean the market you are listing into is softer than the closed prices on your street suggest. Price ahead of the trend and you sell. Chase it down with reductions and you donate negotiating power to the buyer.
If you are buying, those same signals are your green light. Softening supply and demand mean room to negotiate on price, repairs, and rate buydowns that did not exist a couple of years ago. The buyers who win in this market are the ones reading the indicators, not the headlines.
I track these charts for Mesa every week, neighborhood by neighborhood, because the difference between Las Sendas, Eastmark, and Red Mountain Ranch can be larger than the difference between two cities. If you want a straight read on where your specific corner of Mesa is heading before you list or write an offer, that is exactly the conversation I am built for. You can follow my Mesa market updates here or reach out directly.
More From Red Penny Realty
Neighborhood Guides · Market Updates · Buyer Tips · Seller Tips
Want to know which way your Mesa neighborhood is trending before you buy or sell? I read these signals every week. Let’s talk through what they mean for your move.